I don’t believe daily scores are indicative of your final resolved score until at least the 15th day (3rd week) of each 20 day (4 week) round. In fact, I think we put way too much weight into daily scores. Here’s my unscientific analysis to answer the question:
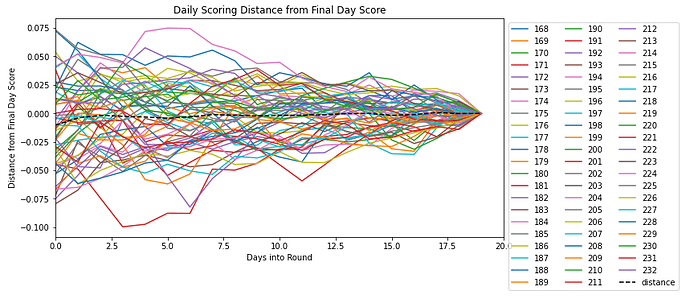
This chart shows a different line for every round. The y-axis shows how far each day’s score is from the final score your model gets on that round. The x-axis shows which day of the round you’re on. On the final day of the round, each round’s lines converges to 0 because that is your final score! The dashed line is the average distance for each day over all rounds. Although the average distance of daily scores from final scores over time looks to be 0, that’s only because it’s completely random whether or not my daily scores are higher or lower than what my final score will be.
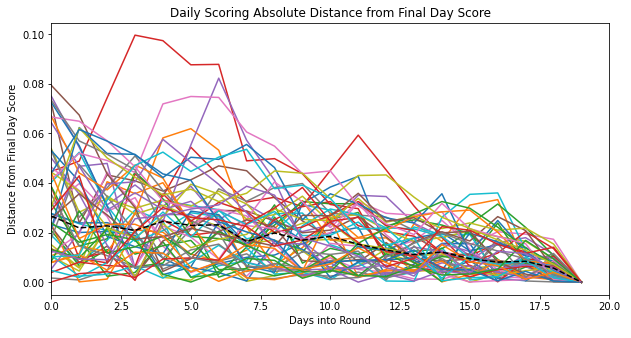
What’s more important is the absolute value of the difference in your distance from your final day score, which looks like this chart below. Clearly, it’s downward sloping. What this tells me is that on the first day of every round, my daily score will be ~0.03 correlation points away from my final score. It’s not until roughly the 15th day that my daily scores are within 0.01 correlation points of my final score. In some cases, even on the 15th day, my daily score can be as much as 0.04 points away from my final score.

And here’s the code if you’d like to check your own models’ “consistencies.” I’ve found most models exhibit the same behavior, though. There is likely something interesting to be found in different models’ changes over daily scores. The same analysis can be done for mmc by changing all references to “correlation” to “mmc”:
napi = numerapi.NumerAPI()
df = pd.DataFrame(napi.daily_submissions_performances("jrai")).set_index("date")
df = df[df["roundNumber"] < 233]

df["distance"] = (
    df["correlation"] - df.groupby("roundNumber")["correlation"].transform("last")
).values

df = (
    df.groupby("roundNumber")
    .apply(lambda x: x.reset_index(drop=True))
    .drop("roundNumber", axis=1)
    .reset_index()
)

#plot distances
df.set_index("level_1").pivot(columns="roundNumber", values="distance").plot(
    figsize=(10, 5), title="Daily Scoring Distance from Final Day Score"
)

df.groupby("level_1").mean().distance.plot(style="k--")

plt.xlim(0, 20)
plt.legend(bbox_to_anchor=(1.4, 1), loc="upper right", ncol=3)
plt.ylabel("Distance from Final Day Score")
plt.xlabel("Days into Round")
plt.figure()

#plot absolute distances
df.abs().set_index("level_1").pivot(columns="roundNumber", values="distance").plot(
    figsize=(10, 5), title="Daily Scoring Absolute Distance from Final Day Score"
)

df.abs().groupby("level_1").median().distance.plot(style="k--", legend=None)

plt.xlim(0, 20)
plt.ylabel("Distance from Final Day Score")
plt.legend(bbox_to_anchor=(2, 1), loc="upper right", ncol=3)

plt.xlabel("Days into Round")
plt.figure()
Edit: I just realized that the absolute distance graph is actually showing the median distance, which might be a better measure than mean distance anyway. I was switching between mean/median and forgot to switch it back. Change any reference between “.median()” and “.mean()” to see the differences.
