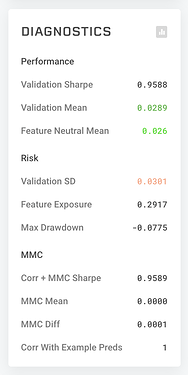
Starting with the coming round, you will receive additional information about your model when you submit.
These metrics will better inform users about the strengths and weaknesses of their models, and give users more direction and insight into the nuances of this unique problem.
The metrics are split into 3 categories.
Performance - Overall measures of performance over the validation set.
Risk - Different ways to assess how likely it is that your model has severe burns in the future
MMC - Different estimates of how your model would perform from an MMC perspective on validation, using Example Predictions as an estimate for the metamodel.
When choosing metrics, we looked for metrics which add one or more of several benefits:
- Convenience for staking decisions
- Correlation to overall model performance (mean and/or sharpe)
- Highlighting the most interesting, unique parts of the Numerai problem.
You will notice that each of the metrics are a different color from red to black(neutral) to green. These grades are based on both research about how the metrics seem to predict future performance, as well as consideration for the general distribution of submissions.
You will also find that in the latest example_models.py (this link is a snapshot of the file as of round 230) which comes in the zip file when you download the round data, we have added the code for calculating all of these metrics. This will allow you to iterate on your model more easily mid-week, as well as explore these metrics in the training part of the data.
For specific information about the features, you can read these community-written posts. We are looking forward to seeing the conversation on these posts and would love it if others shared their additional research contributions.
