Highlights
- We have just released the biggest upgrade to Numerai’s dataset ever.
- The new dataset has 4x the number of rows, more than 3x the number of features, and 20 optional targets.
- The fastest way to get started with the new dataset is to run through the new example scripts
- You can continue to use the old dataset in the same way but models on the new dataset have much higher scores in historical tests.
- The website’s “Download Data” button will only download new data. The legacy data can still be downloaded via the API (GraphQL or NumerAPI)
- The website’s “Upload Predictions” button will only work for predictions made on the new data. Submissions using the legacy data can still be made via the API
New Data
The new data has both more features and more eras. There are now 1050 features instead of 310, and a total of 679 training and validation eras with targets provided instead of 142.
The eras are now weekly instead of monthly. This means that eras match the tournament more precisely, however they are now “overlapping”. This means that nearby eras are correlated with one another because their targets are generated from stock market performance from a shared, or “overlapping”, period of time.
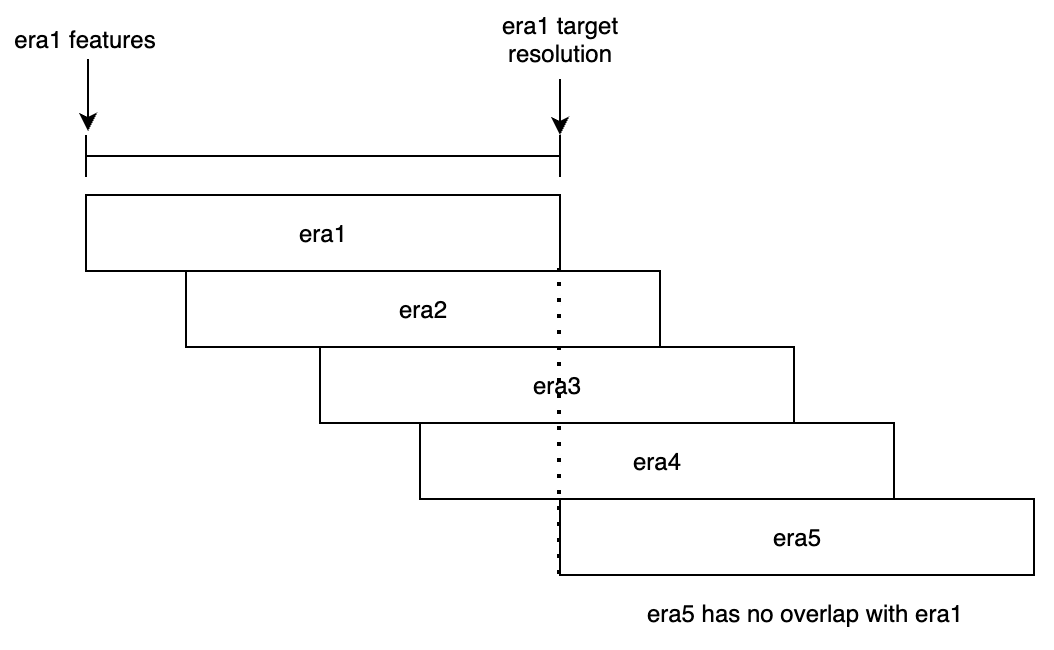
The new “training” period covers the same time period as eras #1-132 in the old data, but is now weekly rather than monthly.
The new “test” period is the same as the previous “test” period.
The new “validation” period covers the same time period as eras #197-212 in the old data plus an additional time period, and is now weekly rather than monthly.
The new “live” period functions just like the “live” period in the old data.
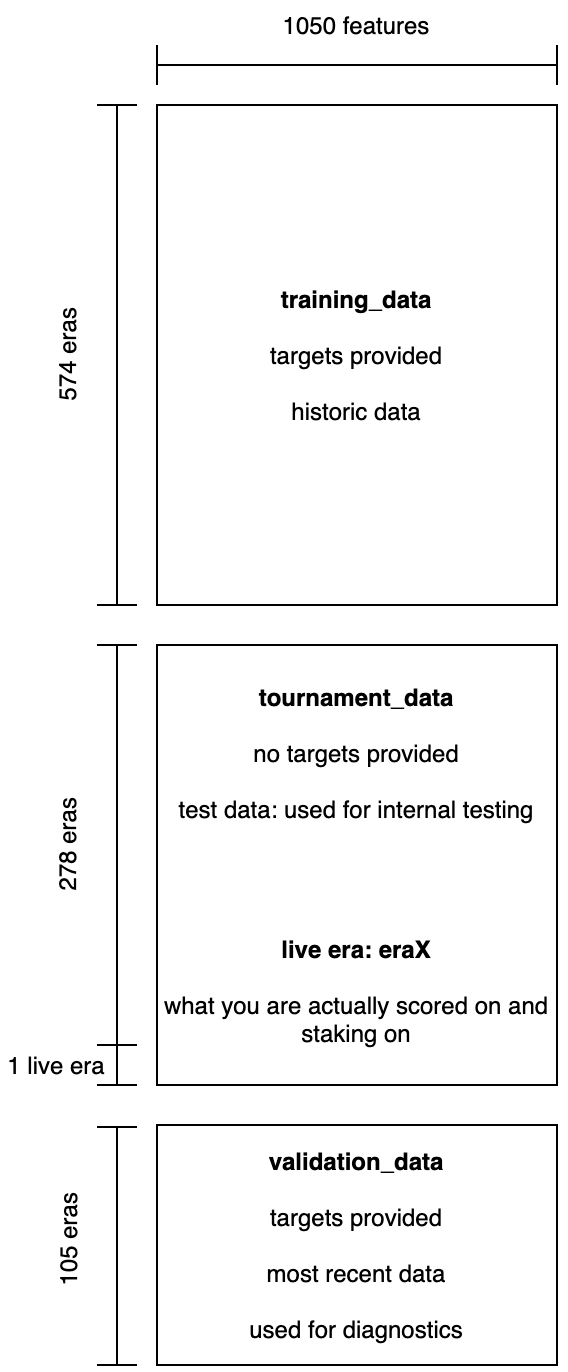
- training_data
- One continuous period of historical data
- Has targets provided
- tournament_data
- Consists of “test” and “live”
- All of these rows must be predicted for a submission to be valid
- No targets provided
- Test is used for internal testing, but is not part of the tournament scoring and payouts
- Live is what users stake on and are scored on in the tournament
- validation_data
- A separate file. Predictions on these rows are not required for submission
- It can be submitted at any time to receive diagnostics on your predictions
- Has targets provided
- This is the most recent data that we provide, far removed from training data. This makes it particularly useful for seeing how your models’ performance declines over time, and how it would have been performing lately.
New Targets
The final major change is that there are now many different targets in the dataset. The tournament target, which is the one you are scored on, is always called “target”. Currently “target” corresponds to “target_nomi_20”, but this may change in the future. However you will also find 20 more targets which are not scored on, but you may find useful for training. The 20 targets consist of 10 different types of targets constructed using 2 different time periods, 20 and 60 days. Additional targets may also be added in the future.
Be aware that some of the new targets have different binning distributions than what you see with Nomi, i.e. 7 bins rather than 5, with less rigid constraints on samples per bin. Training models to be good at multiple targets and/or ensembling models trained on different targets is a great way to improve generalization performance and increase the uniqueness of your model.
The new targets are regularized in different ways and exhibit a range of correlations with each other from around ~0.3 to ~0.9. Due to this regularization you may find that models trained on some of the new targets generalize to predict “target” better than models trained on “target”. Other targets may yield models that appear to generalize poorly to “target” but end up helping in an ensemble.
You may also find that training on the 60 day targets, e.g. “target_nomi_60” yields more stable models when scored on the 20 day “target”. But beware: the eras are even more overlapped when using 60 day targets! You need to sample every 4th era to get non-overlapping eras with the 20 day targets, but every 12th era to get non-overlapping eras with the 60 day targets. If you choose not to subsample in this way, you instead need to be very careful about purging overlapping eras from your cross-validation folds. With great power comes great responsibility!
Finally, be careful about just selecting a target that does well on Validation. Target selection is yet another way to overfit. When in doubt, cross-validate!
API
The new data can be accessed either through the “Download Data” button in the leaderboard sidebar or through s3 links returned by the dataset API using the filename argument; a list of valid filenames can be retrieved through the new list_datasets API query. The new training_data and validation_data files will be the same every week, while the tournament_data file will be updated with the latest live era. Parquet and CSV versions of these files will be available at the start of the round each Saturday; you may retrieve data for past rounds using the round argument of the dataset and list_datasets APIs.
We’ve updated our create_submission API to accept predictions on the new live and test data. Set the optional parameter version to 2 to upload predictions on the new data. If unspecified, version will default to 1 for legacy submissions. Existing pipelines that upload submissions via the API won’t break.
Version 2 of the endpoint is now used by the website when you press “Upload Predictions”. This means that predictions made using the old data will not be accepted via the Numerai website, you will instead have to set version to 1 in create_submission to upload predictions on the old data.
The new version of the submission endpoint does not accept predictions on validation and does not generate diagnostics, instead these will be provided through a new set of diagnostics APIs. You can find a new section for these diagnostics under a model’s “More” dropdown in the numer.ai/models page. The APIs work much like submissions, call diagnostics_upload_auth to get a url to which you can upload your file, then call create_diagnostics to run diagnostics on your upload. You can use the diagnostics API either to list diagnostics for a given model or to retrieve diagnostics for a specific upload.
All of these new API features can be used via the GraphQL API, or through NumerAPI.
Performance
The most important thing about the new data is that it helps models predict the targets more accurately!
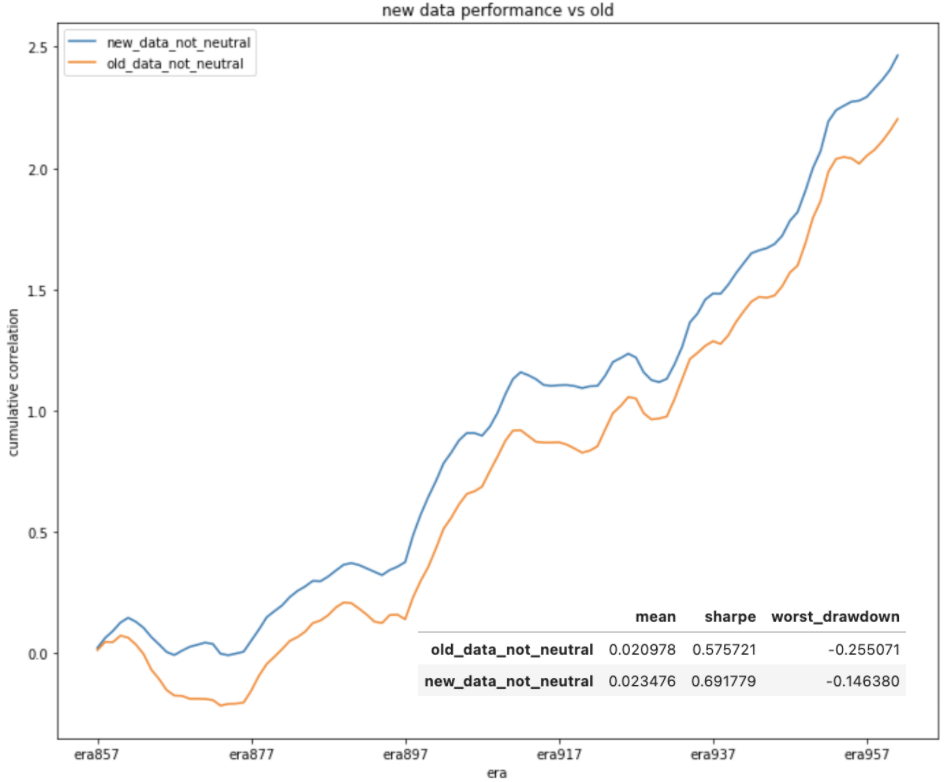
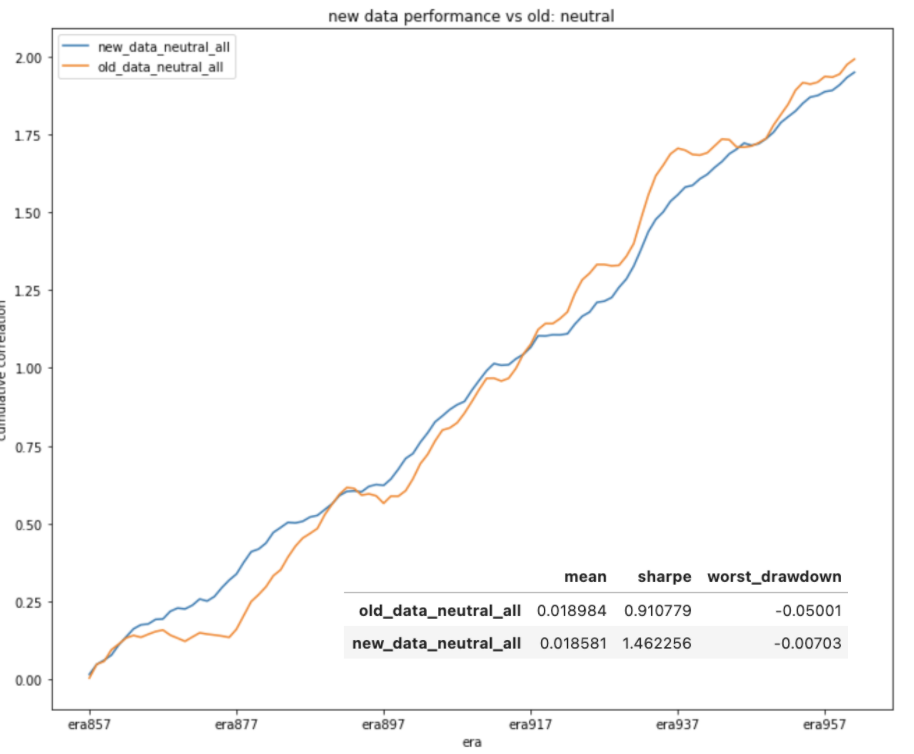
Here’s a comparison of two large XGBoost models, one built on the old data and one on the new data, and tested on the validation period.
The mean correlation increases from 0.0209 to 0.0234, the Sharpe increases from 0.576 to 0.692, and the worst drawdown drastically improves from -25.5% to only -14.6%.
One interesting thing is how a feature-neutral model looks. With so many more features to neutralize to, it actually hurts the mean score, but dramatically improves the consistency and Sharpe - the worst drawdown is only -0.7%!
Another option is to only neutralize to the features whose correlation to the target changes the most over the training set. The theory being “these are the features that we think might be the most risky, so let’s just neutralize to them, but keep our exposure to the rest of the features.” This gives an especially nice looking result.
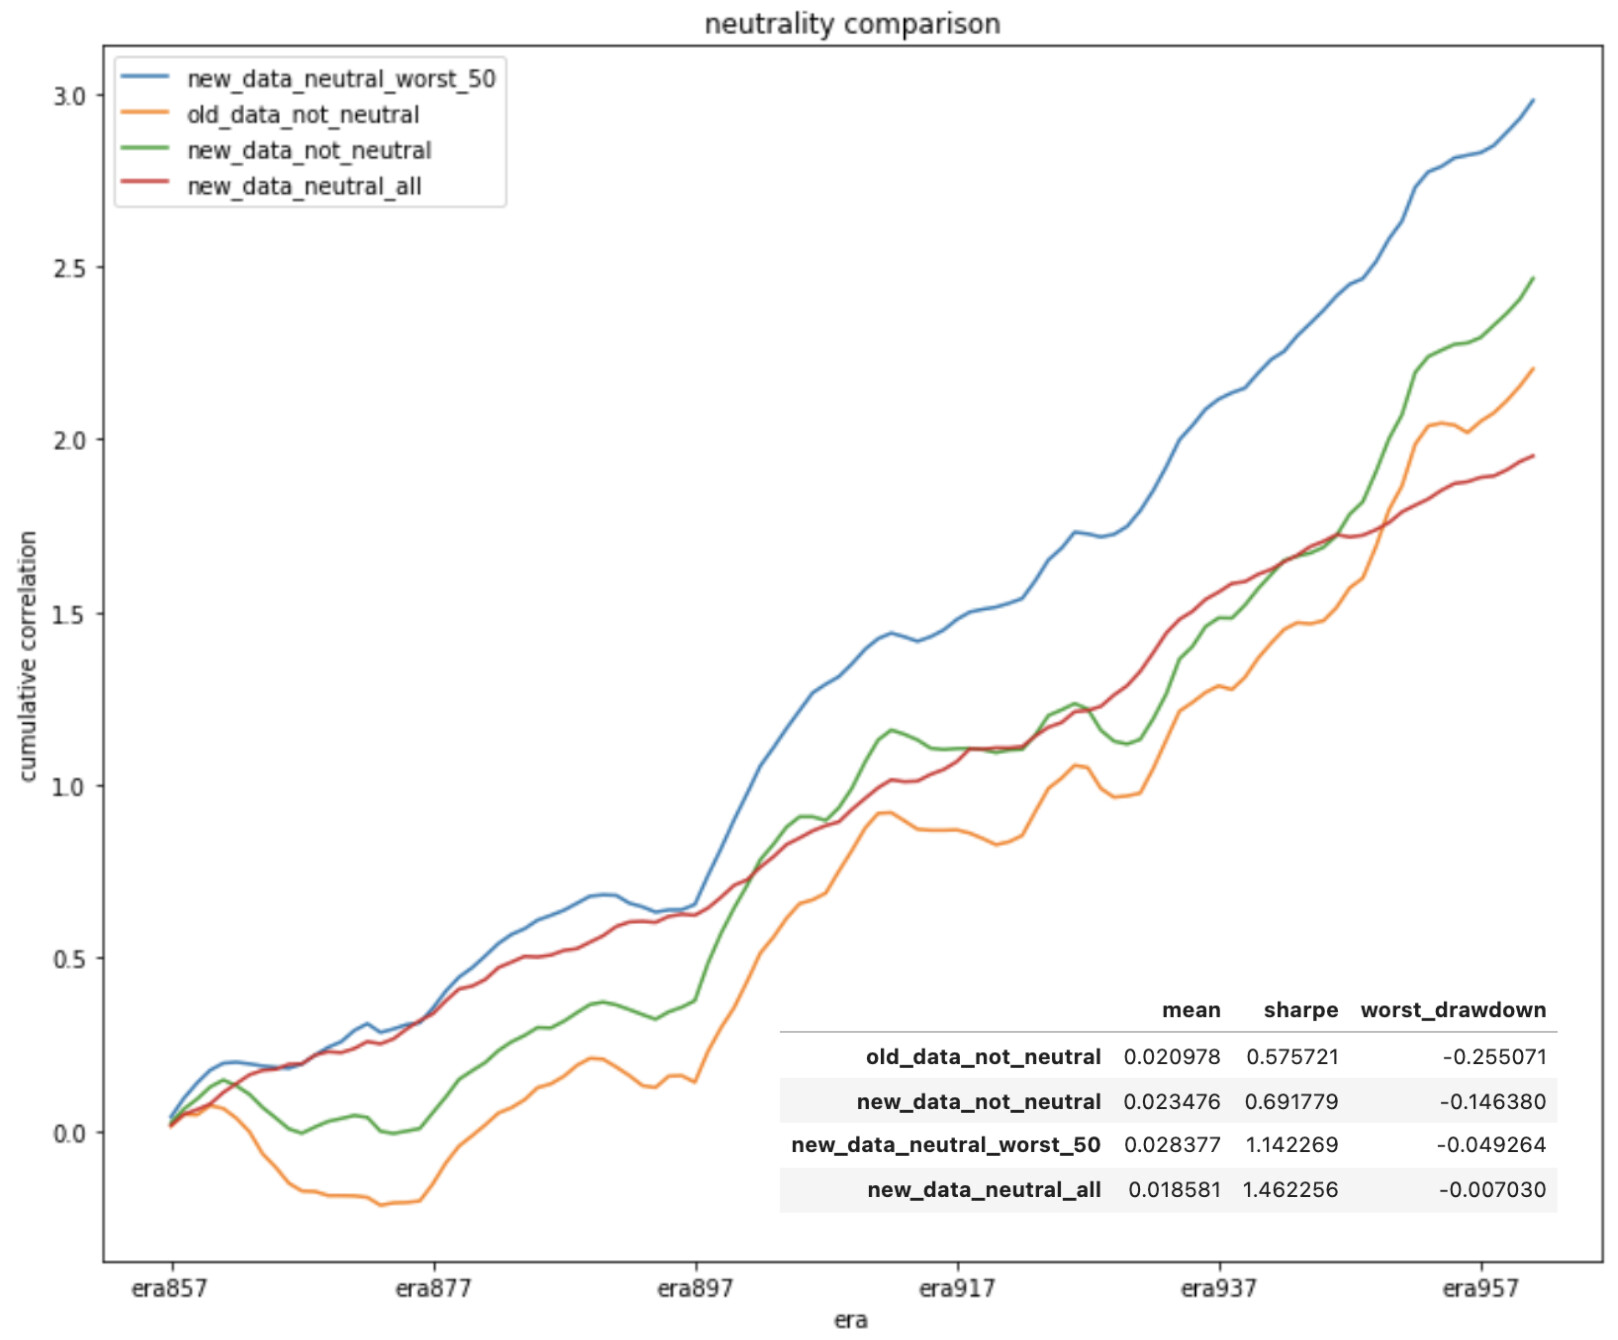
This simple modeling improvement shows the power of having so many more features. With this model, the mean goes all the way up to 0.0284, the Sharpe up to 1.142, and the worst drawdown only -4.93%.
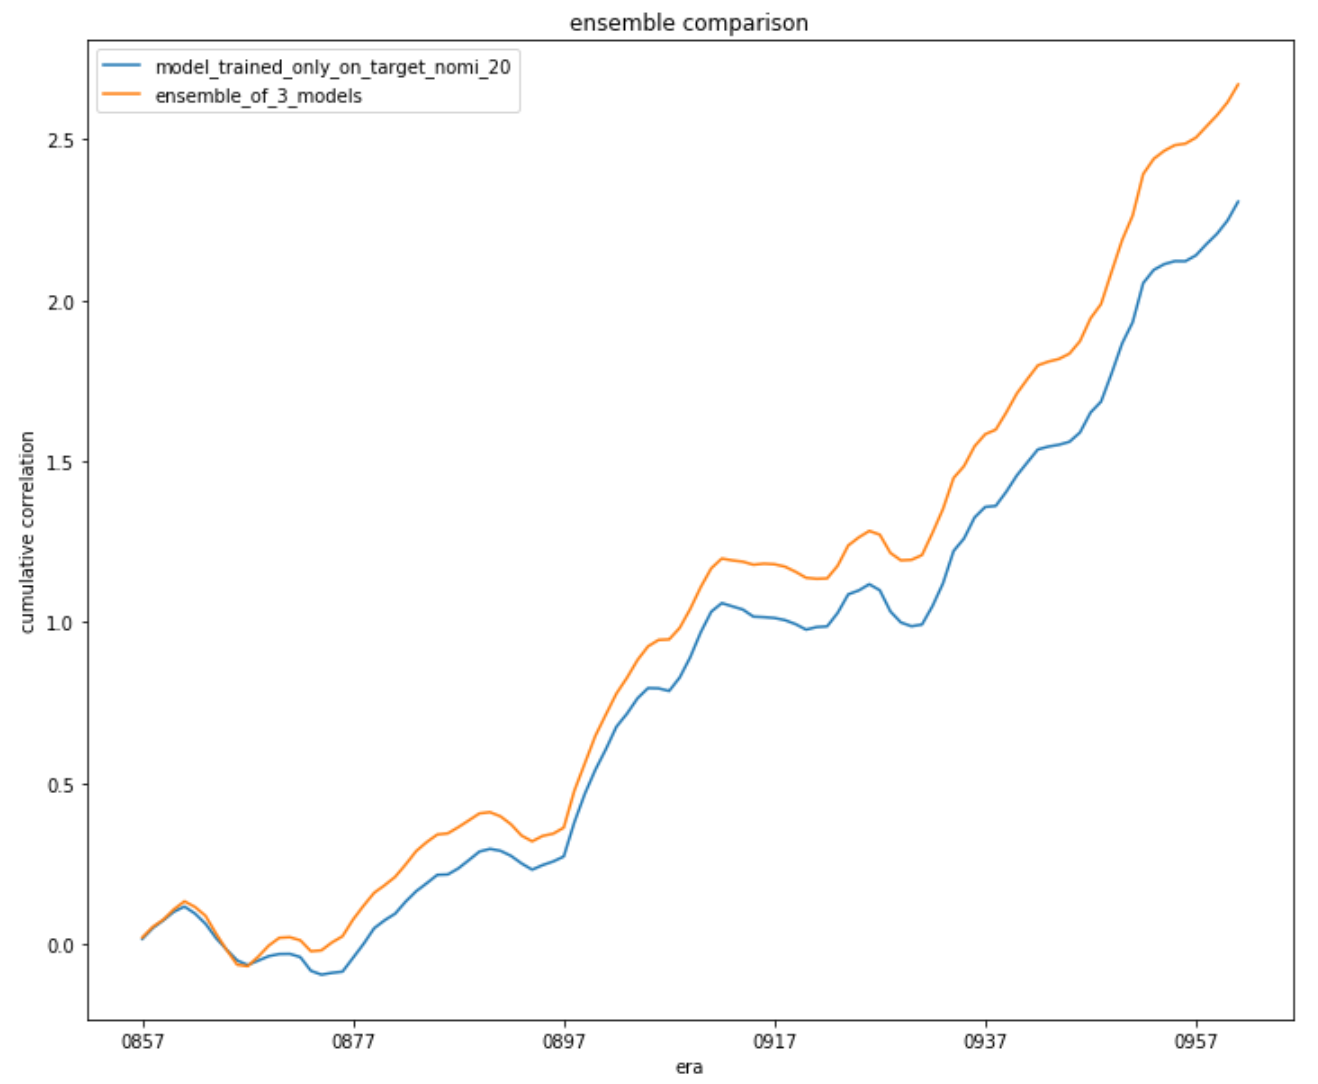
Another characteristic of the new data is that there are many different targets which you can train with. The example below shows that when measuring correlation on target_nomi_20, an ensemble of 3 models each trained on a different target outperforms a model trained on only target_nomi_20.
Details on the techniques above can be found in the example scripts repo, which has been updated with:
- An analysis and tips notebook for the new data
- Two new example model scripts: simple and advanced
Updates:
There has been lots of concern about comparing old models to new models, as well as general difficulty with data size. There have been a few updates to address these:
- There’s a new file accessible via api called
old_data_new_val.parquet
using the utils in the new example scripts you can rundownload_data(napi, 'old_data_new_val.parquet', 'old_data_new_val.parquet', round=280). This will give you the old data, but over the exact same period as the new validation. You will then be able to run your existing models and submit the predictions to diagnostics to get a 1 to 1 comparison against models built on the new data. - I’ve placed new files called
numerai_{validation/training/tournament}_data_int8.parquet/csv. These have features as integers 0 to 4, which result in DataFrames about 30% as large. - I’ve also added
numerai_live_data.parquetandnumerai_live_data_int8.parquetwhich only contain the live era each week.
The Future
There are a couple of other long-term considerations that we need users to begin preparing for.
More data may be added from time to time. These releases will always be announced, but it still has some effect on automation. We haven’t added new features often before now, but we want to be able to add new features regularly without it causing hiccups for users.
For example, simply getting all columns that start with “feature_” won’t work, as your model will receive unexpected columns (unless you are retraining). So your scripts should be explicit about which columns you want to use in order to ensure that they are always able to run even when new data is added. The new example script considers this already.
Features may be unavailable in some weeks. We don’t expect this to happen any time with this current data, but as we add more and more features, it is inevitable that some week, one of the features won’t be available at all in time for the round start. We don’t want to hold up the entire tournament for one feature, so we may put out that feature with NaNs. The new example script will implement the simple practice of filling missing data with 0.5, which you are encouraged to copy or improve upon.