The CoE will get together before Numercon in person and go over this and then possibly get the Bounty for High Quality Data Science Posts passed once we frame it the right way. Possible we can try to do retro bounty for this and in the future once the Bounty for High Quality Data Science Posts passes, community members would write up a short summaries of what they want to work on for a project and time required and we can do approvals before articles are written if that makes sense.
I understand the key point you are debating is the randomness and volatility of TC (or not).
But just a couple of comments on the “other problems”:
Could you elaborate on this? I’m not sure how payout correctness can be confirmed under any of the metrics.
There are some negative TCs up there, but many of them appear to be duplicate submissions. The number might drop significantly if you delete the duplicates. (Maybe this has an effect on the analysis?)

I’m not sure negative TC (or near zero, even more so) means the optimiser is unable to use the signal. If the signal is unique, then yes, the optimiser doesn’t want to use it. But if the signal is common, then it means it is already used optimally, or too much, and using it more won’t help.
Blockquote
Could you elaborate on this? I’m not sure how payout correctness can be confirmed under any of the metrics.
With this I actually meant the correctness of the scores/metrics. It would still be pretty hard but if a few participants who use 50 models were to collaborate they could use the predictions of their hundreds of model to see if there would be any possible realized results of the stocks we predict that make sense with the correlation score they got in the end. With TC something like this seems impossible to me.
Blockquote
There are some negative TCs up there, but many of them appear to be duplicate submissions. The number might drop significantly if you delete the duplicates. (Maybe this has an effect on the analysis?)
About the duplicates I don’t think it changes it that much, because I think any would already be very weird. Randomly eyeballing a few rounds I came up on round 295, where I am counting 6 unique negative TC scores in the top 20. Actually another thing which is pretty surprising is looking at kwak_09 and kwak_10 at round 295.
![]()
![]()
The names, the CORR, the MMC, the FNC, FNCv3 and Corr with meta model seem to indicate that these models are very similar. But the percentile scores are 29 and 78, going from -0.0159 to 0.0326.
Blockquote
I’m not sure negative TC (or near zero, even more so) means the optimiser is unable to use the signal. If the signal is unique, then yes, the optimiser doesn’t want to use it. But if the signal is common, then it means it is already used optimally, or too much, and using it more won’t help.
Many models at the top 20 also don’t have real stakes on it either. For example looking at the top 20 of round 295 again, you can see that none of these models have a stake higher than 0.021 so they are basically unused. So these signals are unused, and for some reason the TC implies they won’t help either. Also I went through them and all of them were also very unique as well, CORR with meta model all below 0.5 with many around 0.2.
And this is all just very weird to me. Models whose individual predictions probably highly outperformed the meta model and also being very unique signals are seen as not contributing to the meta model. These models, as indicated by MMC, are extremely valuable for improving the meta model’s performance. Normally I would think this is exactly what a hedge fund looks for, but apparently, according to numerai’s new metric to judge these models they would rather be a drag on the ecosystem instead of a great asset.
3 Likes
I agree that long-term stability is a good thing for the participant’s perspective. For the back test / hedge fund’s performance I think this matters less, since you pay out for weekly results, and not for the average of multiple rounds.
Although TC seems on a 5 round basis more stable than CORR, currently we are replacing MMC with TC and not CORR with TC, so I am not sure how important this is. MMC seems slightly more stable on this metric as well. If this type of stability is a big concern, then these graphs indicate that FNC is a very interesting choice because it blows the other metrics out of the water on this aspect.
Also, I would like to get the thing I pointed out in the other post under your attention as well. That I randomly stumbled on a model that performs hugely similar in a round on every metric, but very differently under TC. Specifically round 295 kwak_9 and kwak_10.
That might happen if the model, while correlated to the market, was quite different from the meta model, and that if one were to trace a path from one to the other, there might be local minima? If that were the case, then the slight perturbation used to determine the TC would result in a negative result, while a large perturbation might be positive.
As for your idea for those of us with large numbers of models collaborating, I would be happy to contribute. Right now I’m playing with genetic algorithms and looking at resultant (Spearman) correlations between my submissions. In the Tournament they are performing abysmally, but they are giving me some understanding of TC.
1 Like
Hey all. I updated the code because I had some fear of having created a bug earlier, due to some surprising results for me. Having updated the code I don’t think the previous contained any bug.
It also made me realize how few rounds I used to create some graphs. Originally I wanted to only use data after the latest change, the 10X data. This only allowed me to have rounds from round 285-304 in my analysis. Now if you want to take the last 5 rounds, skip 4 rounds due to that being the first round where those 5 rounds are available, and then take the average of the next 5 rounds. You basically only can do this for 6 rounds. (First round you can start is when you take 285-289 as the past performance rounds, and last one being where you take 291-295 as past performance and thus 300-304 as future performance).
Because of this I decided to recreate the graphs as well using the data from round 251-304, allowing me to use 41 rounds of data. This would reduce the variance of these graphs by a lot, but also might cause bias due to both old rounds being less relevant in general (e.g. not having the 10x data) and also I feel that the moments where a new change was introduced are unfair to compare percentiles over rounds with.
‘Backtest’ / last vs next 5 TC

‘Participant evaluating, frequent rebalancing’/ last 5 vs next TC

‘Participant evaluating, infrequent rebalancing’/ last 5 vs next 5 TC

Adding this extra data in general show that last year both Corr and MMC have not performed well on future TC. TC’s performance has increased w.r.t. the recent date in general. TC and FNC seem to have performed on a similar level, with TC performing slightly better. Maybe FNCv3 would outperform TC.
Metric vs own metric, last 5 vs next 5

This shows that in the last year TC was the least stable metric of the four last year.
Conclusion
Taking the whole last year it seems that TC is the best metric to optimize future TC when looking 5 rounds ahead and taking 5 rounds of past performances. FNC seems to perform on a similar level, but slightly worse. Corr and MMC don’t seem to work very well.
Past performances of TC seem least predictive for future performance for its own metric. So TC can be seen as the least stable of the four. So one can expect bigger variance in this metric then you were used to in the past.
I personally also expect some higher variance in TC compared to normal at the start of the implementation 9th of April, because people will be picking different models to stake on due to the new payout structure.
2 Likes
Please DM me a wallet address. Retro bounty will be queued up. Bounty for High Quality data science posts we are working the details but we might ask for your help in the next couple weeks to transfer this over to another section of forums or putting it in an article format for sending out in the newsletter but we will get back to you. Thanks for the detailed post! We will want to see more of these types of posts soon!
4 Likes
Thank you for this!
I had an idea you might be interested in checking. Is the last 5 rounds (or longer) Sharpe of TC more predictive of future TC than the last 5 rounds mean of TC? Sharpe meaning mean(TC)/std(TC).
I think it makes sense to a lot of people that high CORR Sharpe might be more predictive of future CORR than high mean CORR so maybe a similar thing applies to TC.
When I look at user profiles, I find myself switching their TC graph to cumulative mode to see that it’s a straight line up with low “TC drawdowns” and consistent upward TC i.e. high Sharpe. Maybe this is something we can display on profiles.
1 Like
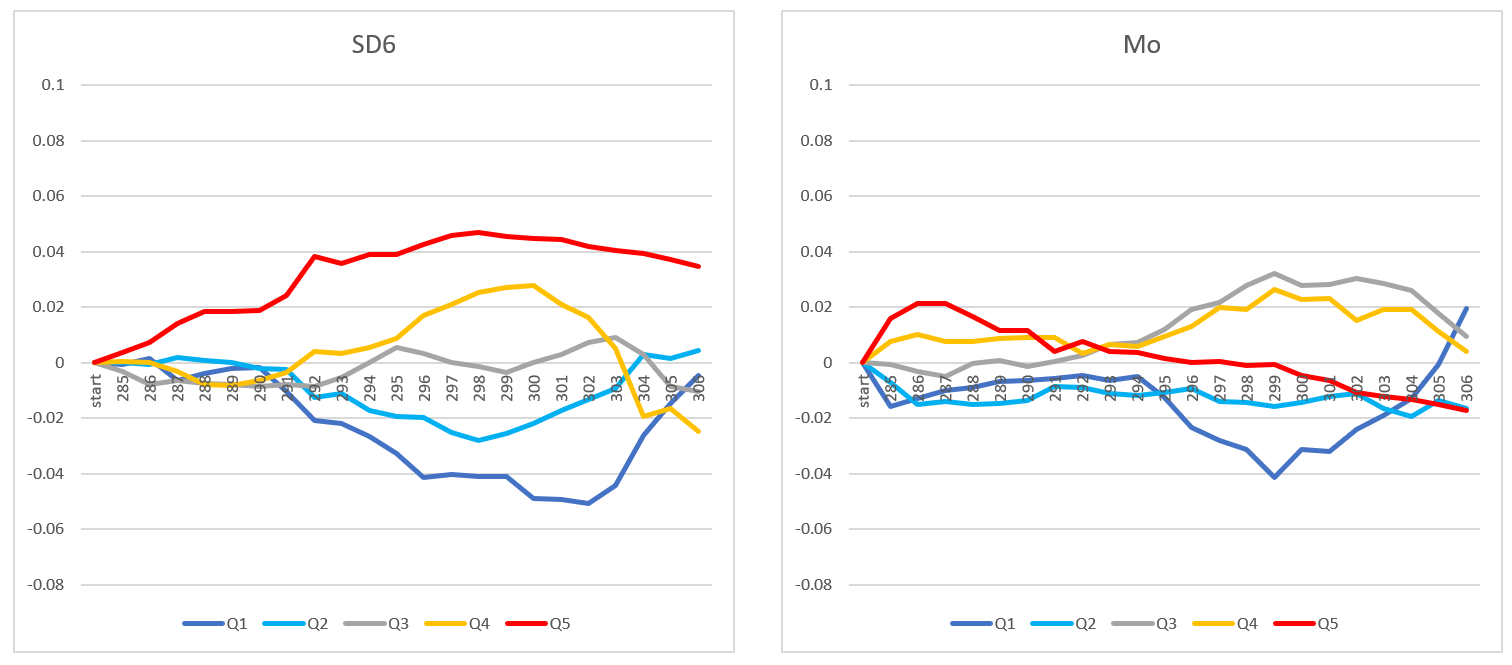
TC Factor Analysis for 22 Rounds from 285 to 306. Used non-overlapping Rounds to see how factors would predict TC in future round. For example, for round 306, used rounds 296-301. Factors were total TC for 3,4,5 and 6 rounds, Sharpe for 5 and 6 rounds, Standard Dev for 6 rounds and Momentum (TC of nearest 3 rounds - TC from furthest 3 rounds). Factors were quintiled and average TC of future round was calculated and linked together over 22 rounds. Then graphed as Quintile index / Average Index. Here are results:

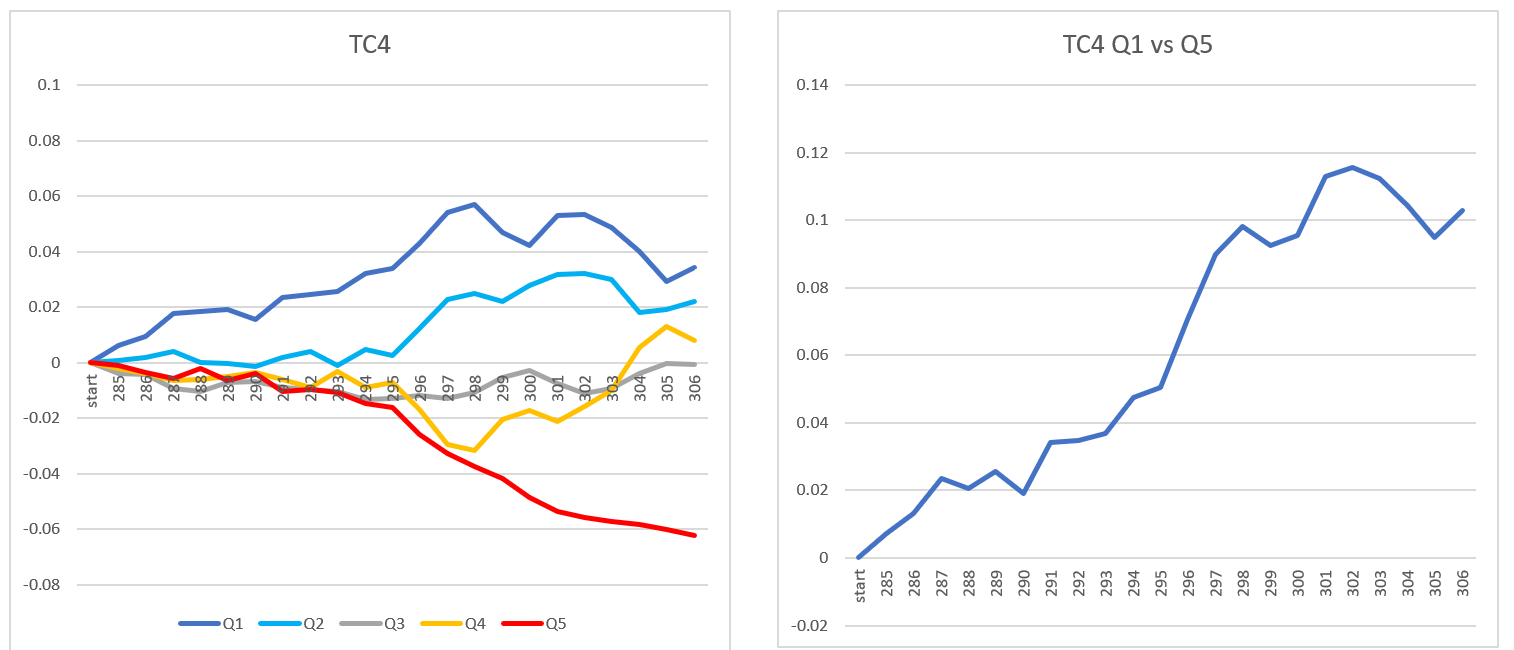


I can explain more later…need to spend some time today at homefront.
5 Likes

In the spirit of biased pattern recognition, 3 past quintile series were chosen that preceded Sharpe6 Q1’s decline. Selecting series for -TC6 Q4, -SD6 Q2 and -Mo Q2, scaling to be equivalent to Sharpe6 Q1 and then averaging the 3 series produces as surefire leading Sharpe6 Q1 indicator of era change! :))
2 Likes