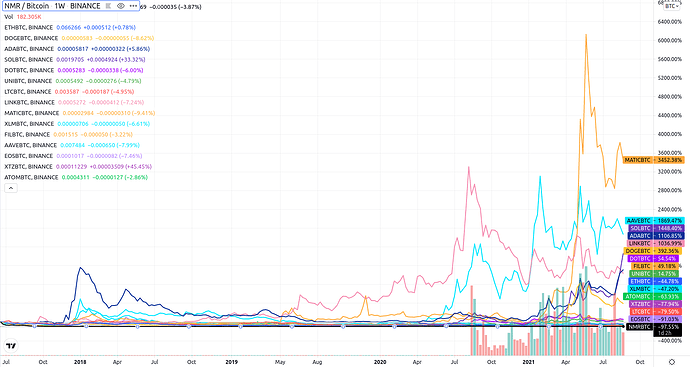
In chat and here in the forum, folks have discussed the value of NMR; its day-to-day price movement mostly, but sometimes there have been attempts to value it using different theoretical frameworks. In this post, instead of rehashing those calculations or sketching out my own theoretical estimates, I want to just summarize actual recent historical price movements, say over the past year or more.
I will but briefly say just here at the outset, that all of the reasonable theoretical discussions (I guess you could say, those that I have been able to follow) point to a somewhat bleak picture for NMR. The reason for the worry is that NMR price seems to be supported mostly by purchases of NMR by data scientists in the main tournament. In the meantime, payouts are going down due to the continued decrease of the payout factor. The main motivational effect of the payout factor, in my experience, is to make it so that I don’t have to worry so much about my models. This means that we can expect model quality to degrade. Again, IMHO, the amount of NMR held by staking data scientists (under exponentially decreasing payout factors) will always be so small that it cannot be thought that an increase in their number will somehow support NMR price stability or even price appreciation, but instead price variations will be fueled mostly by weak speculation on the open market. In other words, there is really very little incentive to buy NMR on the open market. If this is the case then we would expect NMR to weakly trail market movements dominated by more powerful tokens. I think that is bad news for staking data scientists.
OK, so having painted a bleak theoretical picture, let’s look at the data and see what it says about that theory.
The following plots compare the token-to-BTC price ratio (normalized to one at the starting time of each plot) of the top 15 coins on Coinbase by market share (that have at least a year of data, except MATIC which comes in just under a year) – to the NMR-to-BTC price ratio. The time scales are 1. a little over 4 years. 2. 1 year, 3. YTD, 4. 6 months, 5. 3 months. 6. 1 month.
1: ~4 years
2: 1 year
3: YTD
4: 6 months
5: 3 months
6: 1 month
To explain the relative price variations here briefly in case you dont want to have to stare at the plots: At the ~4y timescale, NMR is at the bottom of the pack. At 1 year it is still at the bottom of the pack. At YTD it seems like it starts to want to move (2nd from the bottom). At 6 months it is making some headway at 4th from the bottom. At 3 months it seems like it wants to take off, even surpassing DOGECOIN in 6th from the bottom. But at one month it has fallen firmly to the back of the pack of 16 tokens. The market is firmly saying that NMR lags; it’s nothing special and that nothing that we are doing (we being Numerai, the CoE or the community), is working to make it special in any way.
So question is can something be done to make NMR special? I think the answer is yes, but the theory and the data suggest that it will not be by continuing the present course of actions; I think really radical changes are needed.


 )
) and that’s why we can achive positive correlation with our models.