Generating Feature Groups

I’ve been working on a method to group features together like the old dataset
by making a correlation matrix with the training set, and clustering the columns together with k-means. This groups features together if they have similar behavior. I also tried doing this recursively by repeating the process with each new group to find sub groups.

The full experiment is in this notebook

Csv with feature groups here

I haven’t made any models that use these groups yet, but I’m curious if any of you would find
this useful.

7 Likes

I like the idea and I’ve been playing with that too. I never tried clustering features using kmeans of the corr matrix though. Any motivation for kmeans of the corr matrix?
I did try clustering with some homegrown methods though. When I add mean, std, etc per group as additional features, the resulting models always show improvements OOS. What I did to cluster features was something like:

  1. two features that correlate above some threshold are defined as neighbors
  2. features groups are neighborhoods

You could also try linear regression coefficients instead of corr values to define neighbors, seems to give interesting results as well.

When I first looked at the dataset’s correlation matrix I noticed a repeating diagonal pattern that suggested every ~200 features were similar in some way. I wanted find a way to rearrange the columns to make that pattern go away. Initially I looked at it as a kind of sorting problem and it evolved from there.

It seems to be 210, and as that’s 1/5 of 1050, as a first guess I assume Numerai is collecting 210 features for each stock each day, and then gluing 5 days of those together to form a single row.

Yes, 210 by my count too, the corr matrix seems to be very periodic. I like gammarat’s interpretation, at least that would make sense.

1 Like

Belated thanks! But I do believe I was wrong. Right now I’m leaning towards the idea that (in the original 1050) each set of 5 represents the posterior distribution of a 5 component Gaussian Mixture composed for each of their basic indicators. Or something along those lines, as once you factor an indicator into GMs, there’s multiple ways to play with the posterior distributions to generate new signals.

Of course I could be quite wrong, that’s happened many times before. :laughing:

1 Like

I did group them together by correlation, but the result was meh. Since then, I went more the route of feature selection, neutralization and model stacking.

1 Like

This is interesting, but I would rather use Hierarchical clustering over k-means as you don’t know how many groups you end up finding.

1 Like

I’m still using a fairly simple genetic algorithm, but even in that there’s a lot to play with and test. But the idea struck me (that the feature sets are based on posterior probabilities) because awhile back I started using that in Signals as it seems a relatively clean way to look at high and low performers, and it seems to do ok (well, sometimes :laughing:).

I wonder if this means the dataset is really derived from 210 features, but averages them out over 5 different time windows. For example, maybe there is “volatility 10 day mean”, “volatility 30 day mean”, “volatility quarterly mean” and “volatility yearly mean”.

1 Like

Maybe, but I think that overall would be complicated to implement and keep consistent from week to week, while maintaining scale relationships between different tickers. One of the aspects that draws me to using Gaussian mixture type posteriors is that they will always be between 0 and 1, so it’s just a question of binning w/r to the tournament.

Of course a big drawback to my idea is that would require a slowly evolving mixture process; an idea I want to start playing with in Signals in the next few weeks.

I got curious about the relationships between the various targets, so I have been playing around a bit with those. FWIW, I only use the last 350 or so eras, and rather than using those complicated names I just use numbers 1 to 21.

I thought this plot might be of interest; it’s the correlation between the primary target and the whole set:

1 and 2 really aren’t visible (they’re just ones after all), but what was curious was the somewhat periodic nature of the correlation between the first target and 60 day targets, all in the lower group.

Interesting as well is the best correlation, aside from the 2 perfect ones, occurs for Target 20, which is shown in light blue. Target 20 is a 7 bin target.

4 Likes

I got a bit of time today to look at the last 141 features in v4. It’s interesting; it appears that they they are generated in a number of groups. As before, I’m just using the last 350 eras (excluding the final ones that still have nans).
First the correlations among the raw data, not separated by era:


Next:
The correlations between the correlations of the raw features with target 01:

next, a plot of the cumulative sum of the correlations over the 350 eras, which shows interesting behaviour:


particularly the 5 that appear at the top right of the plot

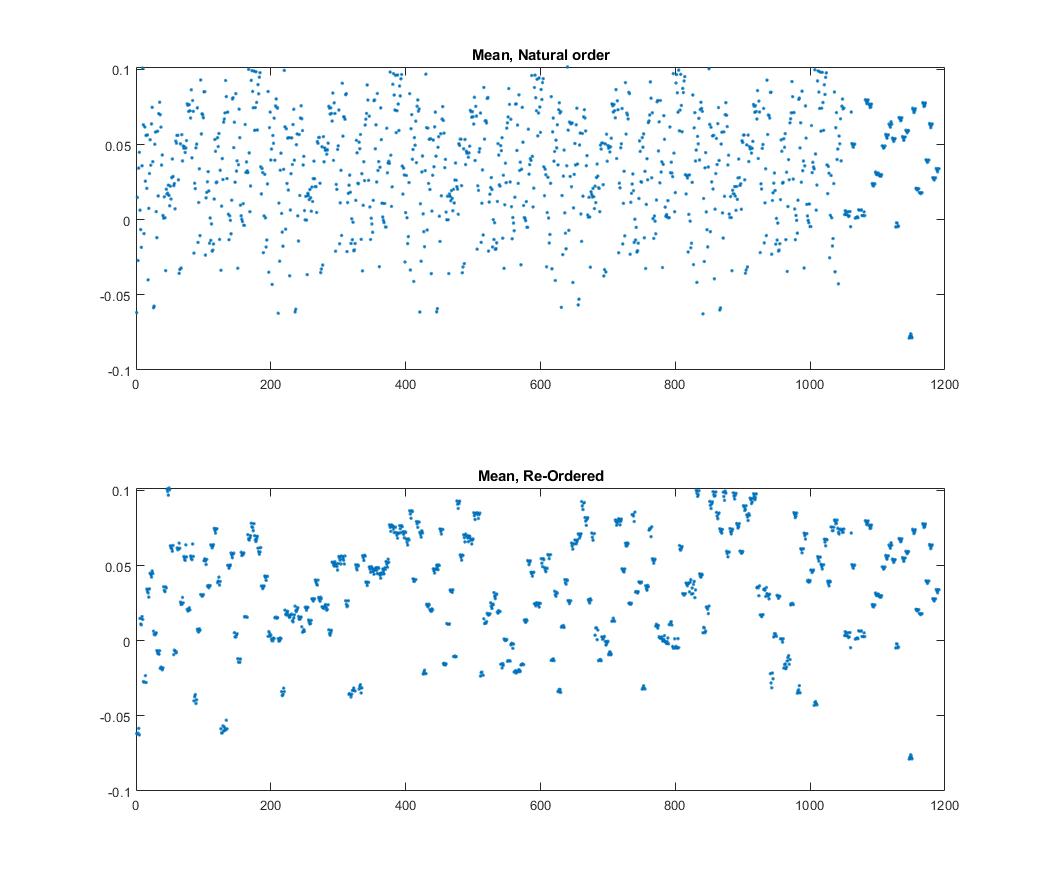
And finally a plot of the mean correlation of each of those features with the target.
Last141x350CorrTarg01means

There’s some interesting clustering going on!

Added, 16 days later. Apparently Discourse won’t allow more than 3 consecutive posts in a row, so I’ve added what’s below as an edit. I really am not trying to spam this board, I just found these results interesting and hopefully of some use to others. But I’ll desist if that’s preferable.

On the topic of clustering:
I’ve taken a first pass at breaking the raw features into pretty simple clusters, resulting in about 235 of them. Right now it’s hit and miss and by hand, so I don’t expect much.

But I was also curious about the different targets as well. So for this ‘experiment’ (using the term loosely :laughing:) I ran the 235 clusters against all 10 of the 20 day targets (those with an _20 in their names, or for those of us more numerically minded, the evenly numbered target columns from 2 to 20, with all targets being 1 to 21). I only use the most recently completed 350 or so eras.

Each cluster, fwiw, is used to generate a Gaussian mixture model from 100 eras from the appropriate target, and then run against the last 250 or so eras of the same target.

That generates interesting results, as shown in the next figure:
TargetClusters

Each separate color represents the mean correlation of the output from a different target. So the dark blue points are the results from 235 clusters built from 100 eras of Target #2 and then tested on 250 eras of the same target. The next (red) group are the same clusters but using 100 eras of Target#4, and so on.

I had expected them to be roughly the same, but surprise, surprise, they aren’t. Obviously Targets #12 (light blue) and #14 (maroon) respond rather well! But #6, #10, and #18 do not. :thinking:

(Fixed an error in the last sentence, it originally read “…#6, #8, and #10…”. My apologies.)

8 Likes

Just for those that don’t think in columns - which targets are those light blue and maroon targets?

1 Like

The targets on the chart are, from left to right:

“target_nomi_v4_20” (dark blue)
“target_jerome_v4_20” (red)
“target_janet_v4_20” (yellow)
“target_ben_v4_20” (purple)
“target_alan_v4_20” (green)
“target_paul_v4_20” (light blue)
“target_george_v4_20” (maroon)

“target_william_v4_20” (blue)
“target_arthur_v4_20” (red)
“target_thomas_v4_20” (yellow)

I bolded the two you asked about (Targets #12 and #14).

1 Like

Targets 11-14 I’ve found to be the most strange and least useful for actually making models, unless I’ve got it backwards and they are somehow the most useful.

1 Like

I’ve not gotten to the point where I can decide yet (which is pretty much the story of my life :laughing:). But for me, the various 20 day targets seem to be variations of one another in that they correlate to each other reasonably well. Is Numerai simply sliding the break points between the various bins to generate different targets? IDK, that’s one of the things I hope to look at in the near future.

Here’s an example:
For the 350 eras that I’m using, I took each possible value of Target #1 and looked at the distribution of of values in Target #12:

This is going to be slightly affected by the fact that if there are NaNs in Target #12, they get replaced by the corresponding value in Target #1. But there’s very few, so that seems to work for ballparking, for now. How those NaNs are distributed is something else to look at.

The next look is at the orderings among just the features themselves. Here, as usual, I’ve taken the last 350 eras that have completed 20 day targets.

For each era, I take the correlation among the features at each era, and then take the mean over the 350 for each correlation. This is a 1191x1191 array, that looks like this:

Note the 1050x1050 pattern that covers most of of the plot, the addition of the 141 extra features makes up the bottom and right boundaries.

Now if one takes the mean value down any column (or across any row, the distribution is diagonally symmetric), a pattern should emerge, which we can see in the top plot of the next figure. Note that in that same plot, features 1051 through 1191 are already forming clusters. So they won’t be touched.

but if we rearrange the first 1050 so that points separated by 210 features are gathered together, we get the second plot in the figure.

Most of the “blobs” in the lower image are comprised of 5 points, often arranged similarly.

1 Like

Notice that each of those blobs have a similar shape. i wonder what those mean?

1 Like

My guess (and it’s only a guess) is that they use similar feature generating algorithm for each Perhaps a five component Gaussian Mixture Model (GMM), in which case the outputs (before normalizing) would be 5 posterior probability streams (very low, low, medium, high, very high, for example) for each original measurement (like, say, a twenty day profile of closing prices.) They’re pretty easy to create, but the utility of their outputs depend strongly on the predictive quality of the input technical indicators…

Please note: I am highly biased, as I used GMMs a lot in my job before retiring.

1 Like