Era-wise Time-series Cross Validation

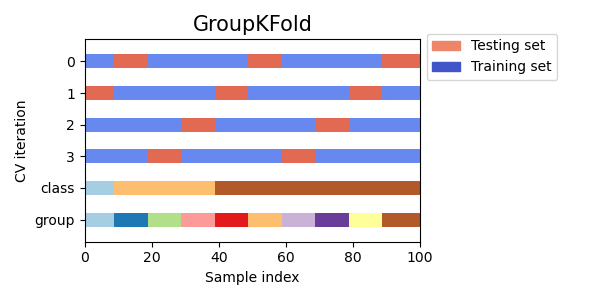
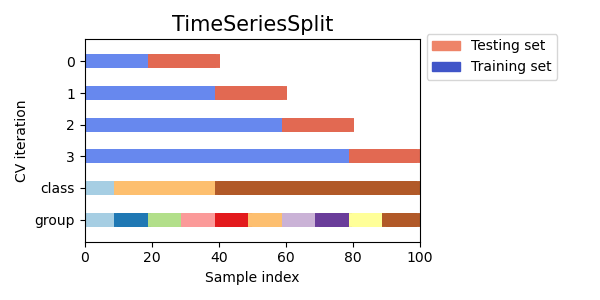
In case you’re not aware, the time-series cross-validation code in sklearn takes a groups argument, but doesn’t actually use it! I like using time-series cross-validation since it prevents you from using any future information to predict out of sample, since your out of sample test set is always in the future. I wrote a sklearn compatible cross validation splitter that can use eras as groups so your splits are always erawise. Below is example code for doing a hyperparameter grid search with XGBoost and era-wise time-series cross validation. My models Niam, NMRO, and MDO were trained in exactly this way (but with different parameter ranges than are used below). MDO also drops some of the worst and best features (according to feature importance) with the exact choices of what to drop determined by this cross validation strategy. See, nothing fancy needed to get a top 3 model :smiley: Now take this information and make even better models!

from sklearn.model_selection._split import _BaseKFold, indexable, _num_samples
from sklearn import model_selection, metrics 
import pandas as pd
import numpy as np
from xgboost import XGBRegressor
import csv
from scipy.stats import spearmanr 


with open('numerai_training_data.csv', 'r') as f:
    column_names = next(csv.reader(f))
    dtypes = {x: np.float32 for x in column_names if
              x.startswith(('feature', 'target'))}
data = pd.read_csv('numerai_training_data.csv', dtype=dtypes, header=0, index_col=0)


features = [f for f in data.columns if f.startswith("feature")]
target = "target_kazutsugi"
data["erano"] = data.era.str.slice(3).astype(int)
eras = data.erano

class TimeSeriesSplitGroups(_BaseKFold):
    def __init__(self, n_splits=5):
        super().__init__(n_splits, shuffle=False, random_state=None)

    def split(self, X, y=None, groups=None):
        X, y, groups = indexable(X, y, groups)
        n_samples = _num_samples(X)
        n_splits = self.n_splits
        n_folds = n_splits + 1
        group_list = np.unique(groups)
        n_groups = len(group_list)
        if n_folds > n_groups:
            raise ValueError(
                ("Cannot have number of folds ={0} greater"
                 " than the number of samples: {1}.").format(n_folds,
                                                             n_groups))
        indices = np.arange(n_samples)
        test_size = (n_groups // n_folds)
        test_starts = range(test_size + n_groups % n_folds,
                            n_groups, test_size)
        test_starts = list(test_starts)[::-1]
        for test_start in test_starts:
            
            yield (indices[groups.isin(group_list[:test_start])],
                   indices[groups.isin(group_list[test_start:test_start + test_size])])


def spearman(y_true, y_pred): 
    return spearmanr(y_pred, y_true).correlation 


cv_score = []
models = []
for lr in [0.006, 0.008, 0.01, 0.012, 0.014]:
    for cs in [0.06, 0.08, 0.1, 0.12, 0.14]:
        for md in [4, 5, 6]:
            models.append(XGBRegressor(colsample_bytree=cs, learning_rate=lr, n_estimators=2000, max_depth=md, nthread=8))


for model in models:
    score = np.mean(model_selection.cross_val_score(
                model,
                data[features],
                data[target],
                cv=TimeSeriesSplitGroups(5),
                n_jobs=1,
                groups=eras,
                scoring=metrics.make_scorer(spearman, greater_is_better=True)))
    cv_score.append(score)
    print(cv_score)
34 Likes

Hi,
thanks for sharing again (also said that in the chat).
The results are like that:
[0.04468379562495979]
[0.04468379562495979, 0.04466911064704264]
[0.04468379562495979, 0.04466911064704264, 0.044610228323998906]

How can I read it?
Since it is nested for loop, does that mean that the first line is lr=0.006 + cs = 0.06 + md = 4 and then the third line is: lr=0.006 + cs = 0.06 + md = 6

Any help, super appreciated!

I believe the print(cv_score) should be outside the for loop.

To answer your question @zempe; try verifying your assumptions by printing those arguments in the for loop, e.g. print(model.learning_rate, score).

@mdo can you elaborate on how your custom class differs from GroupKFold?

Thank you for sharing this code snippet!
It got me thinking about how to do proper cross validation on this dataset.

However I might have found a bug in your code.
Since eras are strings in the Pandas Dataframe taking unique values with Numpy produces for the following group_list variable:
[‘era1’ ‘era10’ ‘era100’ ‘era101’ ‘era102’ … ‘era96’ ‘era97’ ‘era98’ ‘era99’]

The eras are not properly ordered.
This can be fixed by changing the definition of the eras to only take the integer part in account:
eras = pd.Series([int(era[3:]) for era in data.era])

2 Likes

Thanks @koerrie good catch! It’s fixed now. I actually had it right like it is now in my original code, but I guess that’s what I get for trying to simplify code I haven’t looked at in while :smiley:

1 Like

You can just look at the corresponding object in the models list to find the parameters that go with any of the scores

image
image
This is like the latter but splits are only between consecutive eras/groups which is not true for the sklearn version.

3 Likes

I’m fairly new to this so sorry if this is a dumb question. Once you find the optimal set of parameters, and you’re ready to fit the model, is there a way to incorporate the era groups? Or would you just use fit() as normal?

@mdo thanks for the original post and for the plot, really illustrative. I’ve been participating in Numerai for a while but also been working as a data scientist in time series problems. I’ve always used the TimeSeriesSplit approach to force testing on “future” data but always tried to keep using the same amount of training data in each fold.

I mean, if you are using 4 eras for training and 2 for testing in iteration 0, I’d prefer to use 4+2 also in iteration 1 and so on, but seems you’re using 8+2. I don’t have a strong opinion here, and since you are using the same approach for all models it should be ok. In my mind, it resonates as the average error metric won’t be accurate since I’d expect iteration 3 to be better (or worse if your model gets easily overfitted) than iteration 0 because it’s using more training data.

Edit: I’ve found an illustrative image for both approaches.

Is there some reasoning to use “Expanding window” over “sliding window”?

4 Likes

Many of my base models use time-series CV. Until @mdo made that post I did not think anybody else used it. For the models that I have using time-series-CV, I also used an expanding window. My reasoning is that I want the fold size to approach the size of the final training data set because if you use a fixed size which is much smaller than the final training data set size then you might train models that are too greedy and so there is a much greater chance of over-fitting. When we were only allowed 3 models I weighted those ensembles much more to the time-series CVed models and they reached the top 100 very quickly.

2 Likes

Edit: I clearly fail at reading and in-line responses. Zempe was already given an answer to the posed question.

Hi @mdo. In Advances in Financial Machine Learning Marcos Lopez de Prado addresses the failures of CV for financial time series mostly because of false assumptions of observations drawn from an IID process and the leakage / overlap that results from it. As a solution Marcos suggests "purging " and “embargoing” data between training and test sets with a “Purged/Embargoed K-Fold CV”. Now in the case of applying your Era-wise Time-series CV on Numerai training data (especially Nomi) and considering that the eras provided are in chronological order would it make sense to apply such purging / embargoing? To illustrate here is a slide from Marcos’ lecture at Cornell University available online:

2 Likes

There really shouldn’t be a problem with overlap that purging is designed to fix, but you could always try it for added safety. I had considered adding it, but didn’t seem worth it so haven’t explored at all so ymmv. Should be pretty easy to modify my code (or sklearn’s group k-fold) to add the option.

1 Like

So there is no overlap/leakage in the provided dataset. That answers my main question. Thank you @mdo

https://www.kaggle.com/marketneutral/purged-time-series-cv-xgboost-optuna

5 Likes

Using scipy.stats.spearmanr.correlation to score my model gives the following validation mean: 0.0250.

However, the numerai website calculates this same model having validation mean: 0.0254.

Is this small difference expected? The model is the example model: XGBRegressor(max_depth=5, learning_rate=0.01, n_estimators=2000, n_jobs=-1, colsample_bytree=0.1)

Sorry if this is a dumb question. I am a data science noob.

Did you calculate the mean of era-wise correlations?
If you just calculated the correlation ignoring the eras, that could have been the cause of the small difference?

@shonumerai123 You’re right, I just calculated the correlation ignoring the eras. My mistake, thank you for pointing this out.

So, I just went back to my code and calculated the mean of the era-wise correlations using spearmanr.correlation, here are the results:

numer.ai era-wise validation correlation: 0.0254
spearmanr era-wise validation correlation: 0.0255

So, there appears to still be a small difference!

Code snippet:

from scipy.stats import spearmanr 
import numpy as np

# Numerai correlation functions
def correlation(targets, predictions):
    ranked_preds = predictions.rank(pct=True, method="first")
    return np.corrcoef(ranked_preds, targets)[0, 1]
def score(df):
    return correlation(df[TARGET_NAME], df[PREDICTION_NAME])

#Spearman scoring
def spearmandf(df):
    return spearmanr(df[PREDICTION_NAME], df[TARGET_NAME]).correlation

#read data
training_data = pd.read_csv("https://numerai-public-datasets.s3-us-west-2.amazonaws.com/latest_numerai_training_data.csv.xz")
tournament_data = pd.read_csv("https://numerai-public-datasets.s3-us-west-2.amazonaws.com/latest_numerai_tournament_data.csv.xz")
validation_data = tournament_data[tournament_data.data_type == "validation"].copy()

#features and eras
feature_names = [
    f for f in training_data.columns if f.startswith("feature")
]
training_data["erano"] = training_data.era.str.slice(3).astype(int)
eras = training_data.erano
target = "target"

#model
model = XGBRegressor(max_depth=5, learning_rate=0.01, n_estimators=2000, n_jobs=-1, colsample_bytree=0.1)
model.fit(training_data[feature_names], training_data[TARGET_NAME])

#predictions
valpredictions = model.predict(validation_data[feature_names])
validation_data[PREDICTION_NAME] = valpredictions.copy()

#numerai score
validation_correlations = validation_data.groupby("era").apply(score)
print(validation_correlations.mean())

#spearman score
validation_correlations = validation_data.groupby("era").apply(spearmandf)
print(validation_correlations.mean())
1 Like

Yes you should use the numeral correlation function, instead of spearmanr as that is the correct scoring function. I sometimes just use spearmanr because it’s convenient and, as you found, gives virtually identical answers. The difference is spearmanr ranks both inputs (rather than just predictions) before calling the Pearson correlation function.

2 Likes