The simplest way is to use this amazing tool Shiny Numerati - a Hugging Face Space by jofaichow by ia_ai_Joe (I believe).
However if you need minor customizations you need the code. So here is an alternative implementation.
First download your model performance:
$ ./download-model.py  # this generate the models.csv file
Downloading taori01 model 0/99
Downloading taori02 model 1/99
Downloading taori03 model 2/99
...
Then you can plot the performance of an arbitrary round range:
$ ./plot-model.py models.csv 484 540

You can also select only the top/bottom performers or a specific set of models:
$ ./plot-model.py models.csv 484 540 --top-corr 5 # or --bottom-corr
$ ./plot-model.py models.csv 484 540 --top-tc 5 # or --bottom-tc
# or a specific set o models
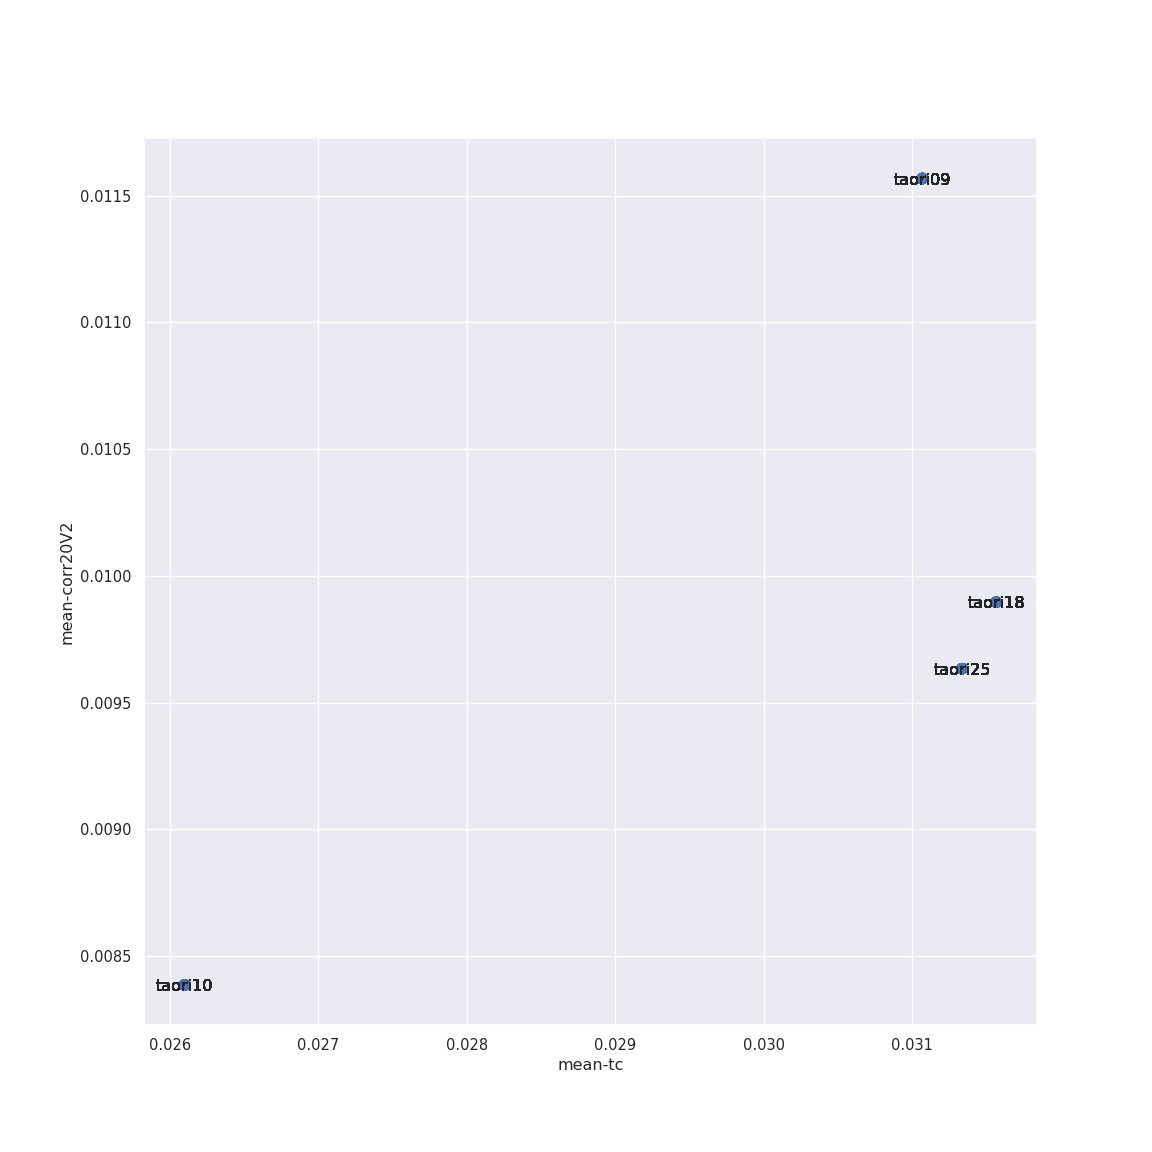
$ ./plot-model.py models.csv 484 540 "taori09,taori10,taori18,taori25"


File download-model.py (edit the line with the list of model names modelNames = [...])
#!/usr/bin/env python3

import sys
import pandas as pd
from numerapi import NumerAPI

napi = NumerAPI(
    #    public_id='',
    #    secret_key='',
    verbosity="info")

query = """
  query($modelName: String!) {
   v3UserProfile(modelName: $modelName) {
    accountName
    id
    username
    roundModelPerformances {
     roundNumber
     roundPayoutFactor
     roundOpenTime
     roundResolveTime
     roundResolved
     roundTarget
     corr20V2
     corr20V2Percentile
     corrWMetamodel
     fncV3
     fncV3Percentile
     tc
     tcPercentile
     selectedStakeValue
     corrMultiplier
     tcMultiplier
     payout
    }
   }
}
"""

#
# Set your model names here
#
modelNames = [ f"taori{i:02d}" for i in range(1,100) ]

data = []

for i,modelName in enumerate(modelNames):

    print(f"Downloading {modelName} model {i}/{len(modelNames)}")

    arguments = {'modelName': modelName}
    userData = napi.raw_query(query, arguments)['data']['v3UserProfile']

    perf = pd.DataFrame(userData['roundModelPerformances'])

    perf['modelName']   = modelName
    perf['accountName'] = userData['accountName']
    perf['id']          = userData['id']
    perf['username']    = userData['username']

    data.append(perf)

df = pd.concat(data)
df.to_csv(f'models.csv', index=False)
File plot-model.py:
#!/usr/bin/env python3

import sys
import pandas as pd
import numpy as np
import matplotlib.pyplot as plt
import seaborn as sns
import seaborn.objects as so

if len(sys.argv) < 2 or sys.argv[1] == "-h" or sys.argv[1] == "--help":
    print("Usage:")
    print(f" {sys.argv[0]} models.csv")
    print(f" {sys.argv[0]} models.csv start-round end-round")
    print(f" {sys.argv[0]} models.csv start-round end-round model1,model2,...")
    print(f" {sys.argv[0]} models.csv start-round end-round --top-corr 10")
    print(f" {sys.argv[0]} models.csv start-round end-round --bottom-corr 10")
    print(f" {sys.argv[0]} models.csv start-round end-round --top-tc 10")
    print(f" {sys.argv[0]} models.csv start-round end-round --bottom-tc 10")
    sys.exit(1)

# Read input file
df = pd.read_csv(sys.argv[1])

# drop data not required
df = df[ ["corr20V2","tc","roundNumber","modelName"] ]

# Start round
if len(sys.argv) >= 3:
    start_round = int(sys.argv[2])
    df = df[ df.roundNumber >= start_round ]

# End round
if len(sys.argv) >= 4:
    end_round = int(sys.argv[3])
    df = df[ df.roundNumber <= end_round ]

# Model selection
if len(sys.argv) == 5: # list of models
    models = sys.argv[4].split(",")
    df = df[ df.modelName.isin(models)]
elif len(sys.argv) >= 6: # top/bottom performers
    what = sys.argv[4]
    amount = int(sys.argv[5])
    if what in ("--top-corr", "--bottom-corr"):
        mean = df.groupby(["modelName"])["corr20V2"].mean()
    elif what in ("--top-tc", "--bottom-tc"):
        mean  = df.groupby(["modelName"])["tc"].mean()
    mean = mean.dropna()
    if what.startswith("--top"):
        mean = mean.sort_values(ascending=False)
    elif what.startswith("--bottom"):
        mean = mean.sort_values(ascending=True)
    print(f"Sorted models ({what}):")
    print(mean)
    selection = mean.iloc[:amount]
    df = df[ df.modelName.isin(selection.index) ]
    df = df.sort_values(by="modelName", key=lambda col: col.map( lambda val: selection.index.get_loc(val) ), ascending=True)

# set new index
df = df.set_index(["modelName","roundNumber"], verify_integrity=True)

# sort round numbers
df = df.sort_index(level=["roundNumber"], ascending=True, sort_remaining=False)

# Compute cumulative
def add_cumulative(df, column):
    df[f"cumulative-{column}"] = df.groupby(["modelName"])[column].apply( lambda g: ((g.fillna(0.) + 1.0).cumprod() - 1.0).reset_index(level=0, drop=True) )

add_cumulative(df, "corr20V2")
add_cumulative(df, "tc")

# Compute mean
def add_mean(df, column):
    df[f"mean-{column}"] = df.groupby(["modelName"])[column].transform('mean')

add_mean(df, "corr20V2")
add_mean(df, "tc")

print("Saving data to models-plot.csv...")
df.to_csv(f'models-plot.csv')

###############################################################################

sns.set_theme()
plt.rcParams["figure.figsize"] = [25,12] # default is [6.4, 4.8]

plt.clf()
ax = sns.lineplot(data=df, x="roundNumber", y="corr20V2", hue="modelName")
if ax.get_ylim()[0] < 0:
    ax.axhspan(ymin=ax.get_ylim()[0], ymax=0, facecolor='red', alpha=0.3)
ax.get_figure().savefig('corr20V2-by-round.png')

plt.clf()
ax = sns.lineplot(data=df, x="roundNumber", y="cumulative-corr20V2", hue="modelName")
if ax.get_ylim()[0] < 0:
    ax.axhspan(ymin=ax.get_ylim()[0], ymax=0, facecolor='red', alpha=0.3)
ax.get_figure().savefig('cumulative-corr20V2-by-round.png')

plt.clf()
ax = sns.lineplot(data=df, x="roundNumber", y="tc", hue="modelName")
if ax.get_ylim()[0] < 0:
    ax.axhspan(ymin=ax.get_ylim()[0], ymax=0, facecolor='red', alpha=0.3)
ax.get_figure().savefig('TC-by-round.png')

plt.clf()
ax = sns.lineplot(data=df, x="roundNumber", y="cumulative-tc", hue="modelName")
if ax.get_ylim()[0] < 0:
    ax.axhspan(ymin=ax.get_ylim()[0], ymax=0, facecolor='red', alpha=0.3)
ax.get_figure().savefig('cumulative-TC-by-round.png')


plt.rcParams["figure.figsize"] = [12,12] # default is [6.4, 4.8]

plt.clf()
fig = plt.figure()
p = so.Plot(data=df, x="mean-tc", y="mean-corr20V2", text='modelName').add(so.Dot(pointsize=8)).add(so.Text(halign="center"))
p.on(fig).save('meanTC-VS-meanCorr20V2.png')